Do you review your year end traffic via
Google Analytics to see where your marketing had the most return on investment (ROI)? It can be incredibly beneficial in planning out your marketing game plan for the new year!
If you aren't using Google Analytics yet, get that stuff set up ASAP! If you aren't sure how to set it up with your online shop, do a quick Google search for a tutorial. This data is a powerful tool & by understanding how people are finding your site, which sites they purchase from and which sites bring you the most revenue, you can use those numbers to launch your business to the next level! When doing my year-end review, I look at everything but really only analyze three things: revenue, conversion rates & traffic sources.
Why these three?
Because to me, examining these three statistics helps me figure out:
- What I did right in the previous year
- What worked for my business
- What didn't work for my business
- Where I should be investing my precious time/effort/hard earned marketing money
To give you a better sense of what kind of goodness you can divulge from these statistics I am going to share a peek at my year in review as well my top three sources in each category! I invite you to explore your own. You may just be surprised by how the stats stack up! Like me, you may just find that all that time you spend in those Facebook groups really is just a waste of time - it may be bringing you traffic, but if if has a low conversion rate or doesn't rank high on your sources of revenue, you need to either reevaluate how you spend you time on that platform, create a new marketing strategy or ditch it altogether to focus on what does bring in the buyers!
First up, head over to Google Analytics and select the time frame from January 1st of the previous year December 31st of that year in the top right hand corner. Now get ready to dig in!
Revenue
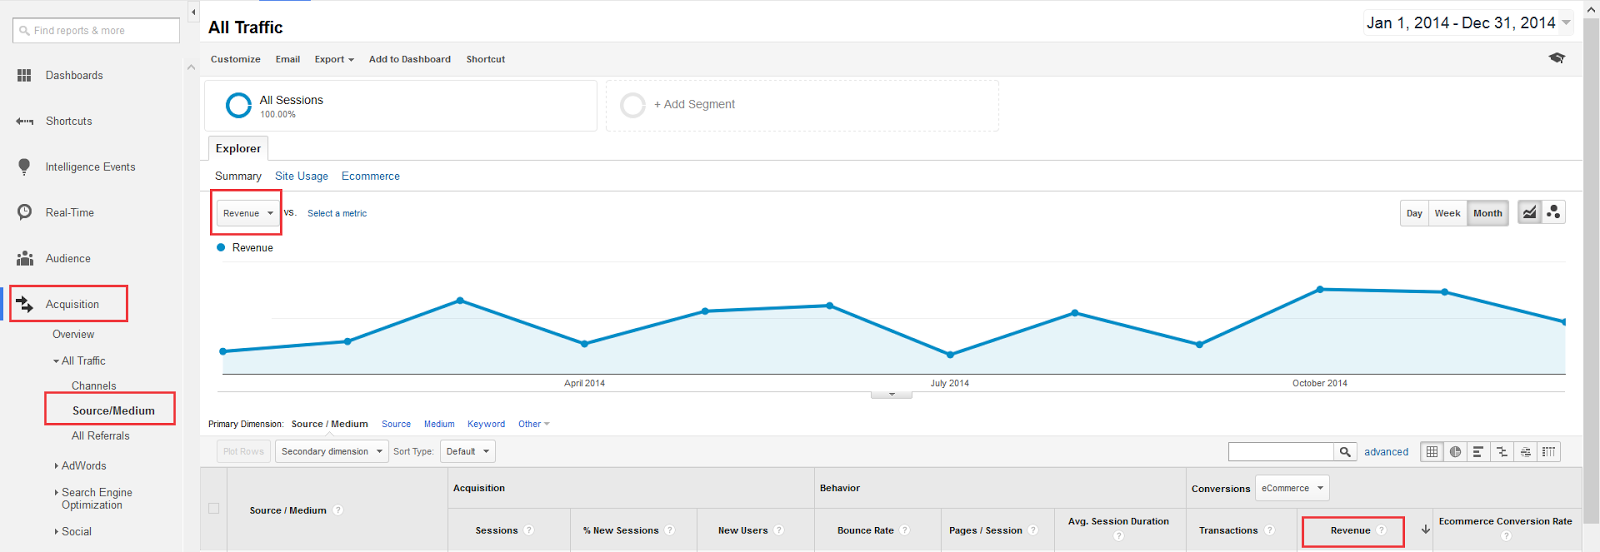 |
| To access this data, click Acquisition>All Traffic>Source/Medium, then select Revenue in the right corner below the graph. To view the graph, click the highlighted drop down menu & select "Revenue". |
When I look at what brought me the most revenue in my
monster shop during the previous year - and what brought me the least - I can spend my precious time & hard earned money better in the next year. I can also use this data to determine slow times where maybe I could put in more effort marketing. On the chart above the spike in March was because it was my last stocking before a big show in April, which accounts for the dip, and the dip in July was because we were on vacation most of the month & I only did a small stocking that month. September is always slow for me - end of summer vacations, back to school expenses, extra-curricular fees & and all that other fun stuff usually sucks all the extra spending money out of parents, who are my target audience.
Using this data I can also discover things like if paid ads on blogs had little to no ROI & then I will just save that money instead of renewing the paid ad. If a blog post someone did on my products brought me in loads of revenue, I would know I should collaborate with that blogger again. See how I can use that data to grow my business & weed out things that aren't helping it grow?
Here are the top three sources of revenue for Lu & Ed last year.
1. Direct traffic. The term “direct” loosely means no referrer, so they came to my site on their own accord, basically, either through a book mark or typing in the URL.
2. Instagram. I spent all of last year experimenting on & researching this platform & am so glad to see that all that effort paid off!
3. Facebook - but with Instagram bringing in several hundred more dollars in revenue than FB.
Traffic
 |
| Click Sessions while on the same view as above to see your traffic sources. Click the drop down box & select Sessions to view as a graph. |
It is so good to know where people are coming from, how they are finding you & what platforms you are marketing on that is bringing people to your site - and it ties in directly with the conversion rate info, helping you to know what sites you are spending time on but don't have much in the way of ROI.
My top three traffic sources:
1. Direct traffic accounts for 41.39% of ALL traffic & 50.1% of new users coming to my shop for the year of 2014!
2. Facebook
Conversion Rate
 |
| To view this data, click the far right option for Ecommerce Conversion Rate to sort source sites by conversion rate. Select it from the drop down to view as a graph. |
More important than knowing where people are coming from is knowing where they come from that results in the most sales. If you don't know what a conversion rate is or don't understand why it's so important to your business, I highly recommend this post from Aeolidia:
Improving Sales by Understanding Your Conversion Rate. Basically, I use this data to determine which site turns more browsers into buyers. By knowing this, I know where I should be focusing more energy. The dips seen in the graph above in April is because I had a show that month & I barely had any inventory in my shop. The dip in July is because I was out of town for most of the month & only did one stocking that month.
Top three sources of traffic with the highest conversion rates:
1. Direct traffic leads again (strongly). Seeing this as the number one for all three items makes my heart so happy - it means that I am on the road to building a strong brand & web presence!
2. My
email list. I launched my campaign at the beginning of last year & it already accounts for 28.7% of total sessions on my website!
3. Instagram. Again, yay!
Quick example of how to use this data
So, let's take a peek over these charts & stats above. Notice that Facebook may have made the top three for traffic, it didn't make the top three (or ten, even) for conversion rate? It may be bringing people to me, but they aren't buying. Why is that?
For me, personally, it's because I started the year in several Facebook groups. I quickly realized after reviewing my stats for the previous year that while a group may have 12,000 members, that doesn't mean it will do jack for my business. I could share a product & get 59 comments, but not a single purchase - because
other makers are not my target audience. Over the Spring I made adjustments to
how I marketed - and saw a huge increase in my total conversion rate! You can see how it sky rocketed from 1.38% to over 3% in a matter of months from January to March when I started making the switch in how I marketed & where I invested my time, thanks to my stats from the previous year.
So here's the low down: If one site is bringing you traffic but not sales, ask yourself why. What could you do differently? Is it worth the effort? Could you better spend the time/resources on a site that brings in more revenue or has a higher conversion rate?
Do a little homework. Once you pull up the Analytics for 2014, write down what brought you the most revenue, the most traffic and which sites have the highest conversion rates & use these as a guide when prioritizing where you spend your time, energy & money for your business. Taking the time to review these numbers last year & apply what I learned made 2015 the best year ever for my business!
Do you currently use Google Analytics? If so, how do you feel about your year-end review of revenue, traffic & conversion rates? Is it what you expected?